OECD releases final overseas aid figures for 2018
Last month the Organisation for Economic Co-operation and Development’s (OECD) Development Co-operation Directorate released the final figures for total Official Development Assistance (ODA) by Development Assistance Committee (DAC) members in 2018.
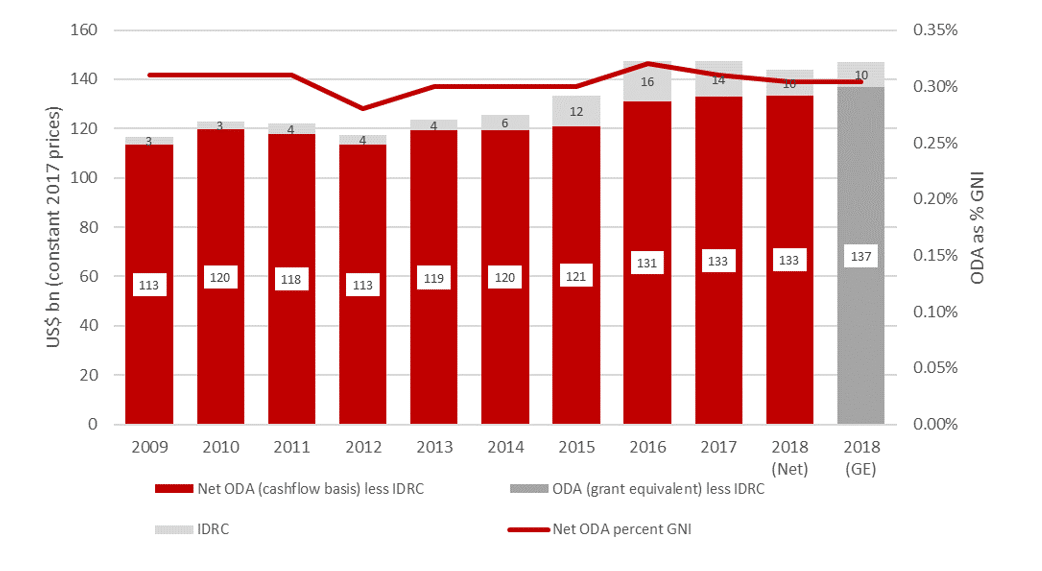
These figures, the first set of ODA statistics published under new rules regarding how ODA is accounted for*, show that total ODA fell in real terms for the second year in a row, down by US$4.1 billion (2.7%) on the net ODA measure and by US$2.5 billion (1.6%) under the new grant equivalent measure. This fall was due to lower spending on In-Donor Refugee Costs (IDRCs), which fell by US$4.2 billion. ODA as a percentage of donors’ Gross National Income (GNI) remained unchanged at 0.31%, having previously fallen from 0.32% in 2016 to 0.31% in 2017.
DAC members’ net ODA (2009-2018), grant equivalent ODA (2018) and net ODA as % of GNI (2009-2018)
Total net ODA by donor (2017-2018)
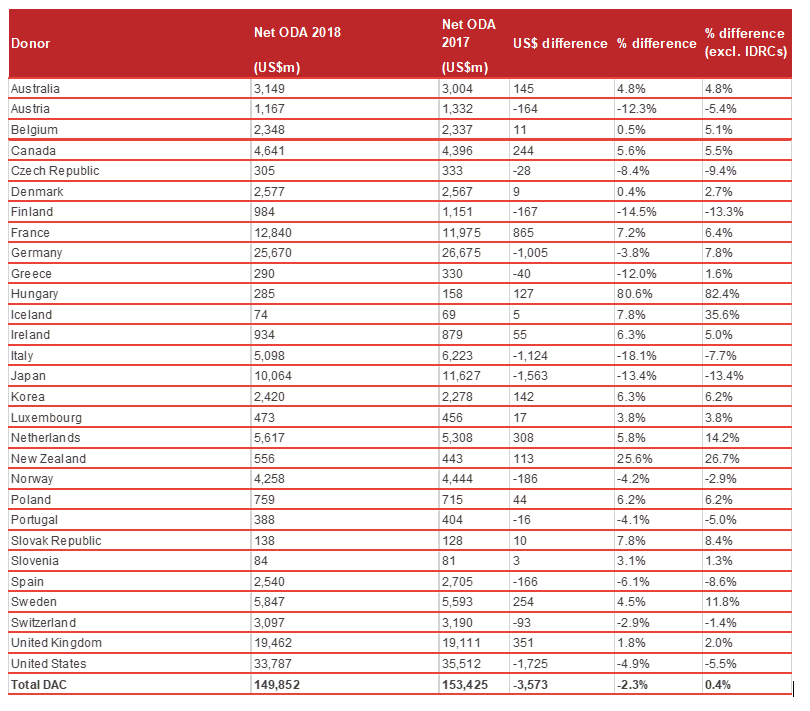
Despite a continued reduction in its relative aid spending (now representing only 0.16% of GNI), the United States continued to be the single largest provider of net ODA in absolute terms (US$33.7bn in grant equivalent ODA at current prices and exchange rates), followed by Germany (US$25.9bn: 0.63%), the United Kingdom (US$19.5bn: 0.7%), Japan (US$10.1bn: 0.20%) and France (US$12.5bn: 0.44%) In cash terms the largest reductions in net ODA were reported by four members of the G7: the US (US$1.8 billion), Japan (US$1.6 billion), Italy (US$1.3 billion) and Germany (US$0.8 billion).
DAC members’ ODA as a percentage of GNI in 2018
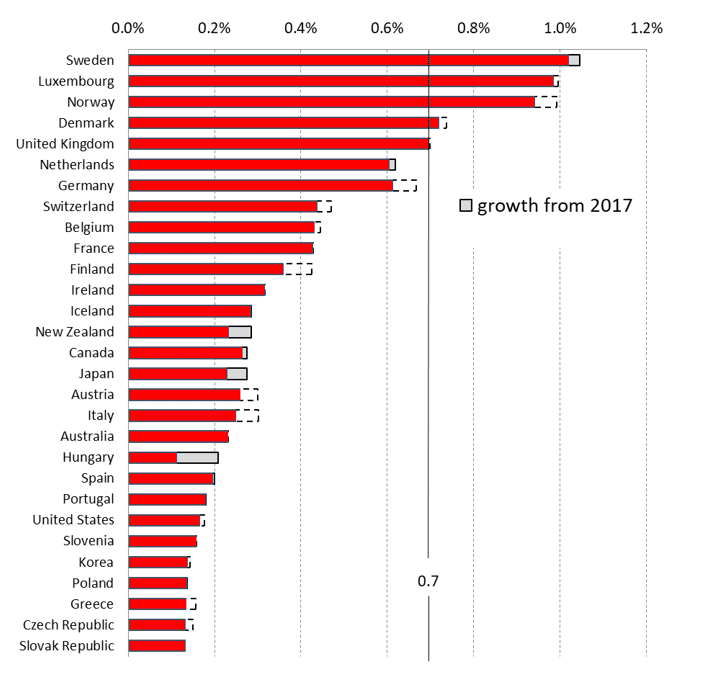
Relative to GNI, Sweden (1.04%), Luxembourg (0.98%) and Norway (0.94%) remain the most generous donors, followed by Denmark (0.72%) and the United Kingdom (0.7%). Only five donors (including the United Kingdom) achieved the 0.7% of GNI ODA target in 2018.
Subscribe to our newsletter
Our weekly email newsletter, Network News, is an indispensable weekly digest of the latest updates on funding, jobs, resources, news and learning opportunities in the international development sector.
Get Network NewsTop recipients of total DAC ODA in 2018
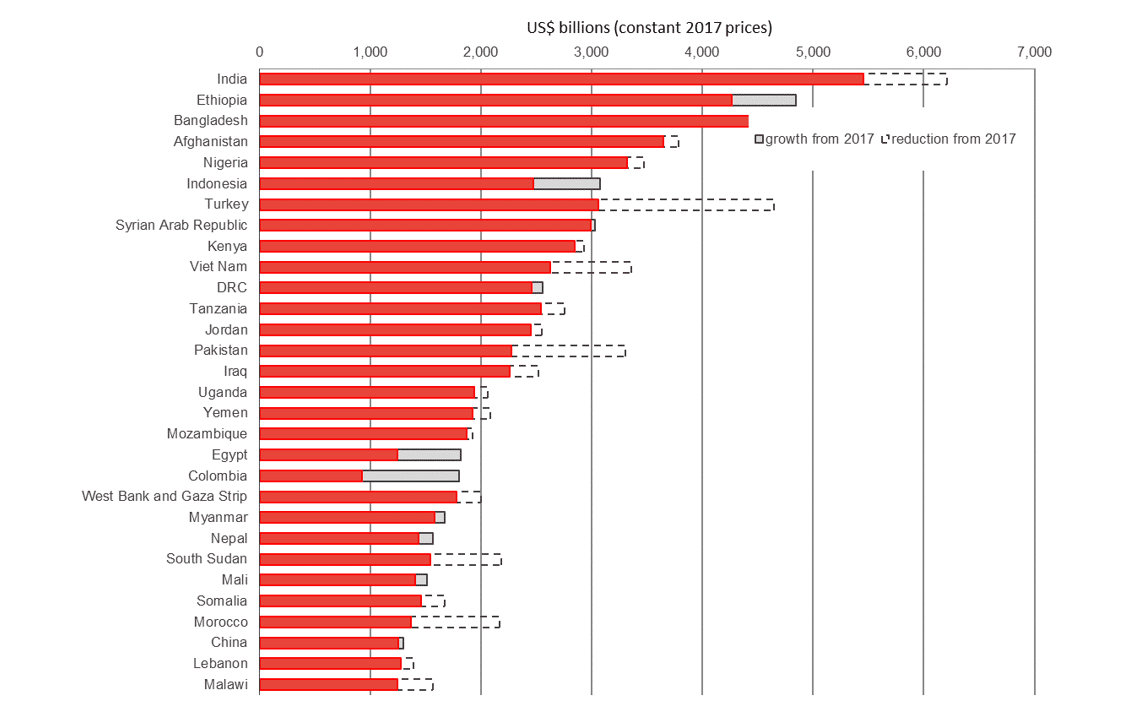
India was the largest recipient of DAC ODA^ in absolute terms in 2018, followed by Ethiopia and Bangladesh. Countries that saw significant increases in ODA receipts in 2018 including Bangladesh, Indonesia, Egypt and Colombia. Countries with large decreases included India, Turkey, Pakistan, South Sudan and Morocco.
Top per capita recipients of DAC ODA in 2018
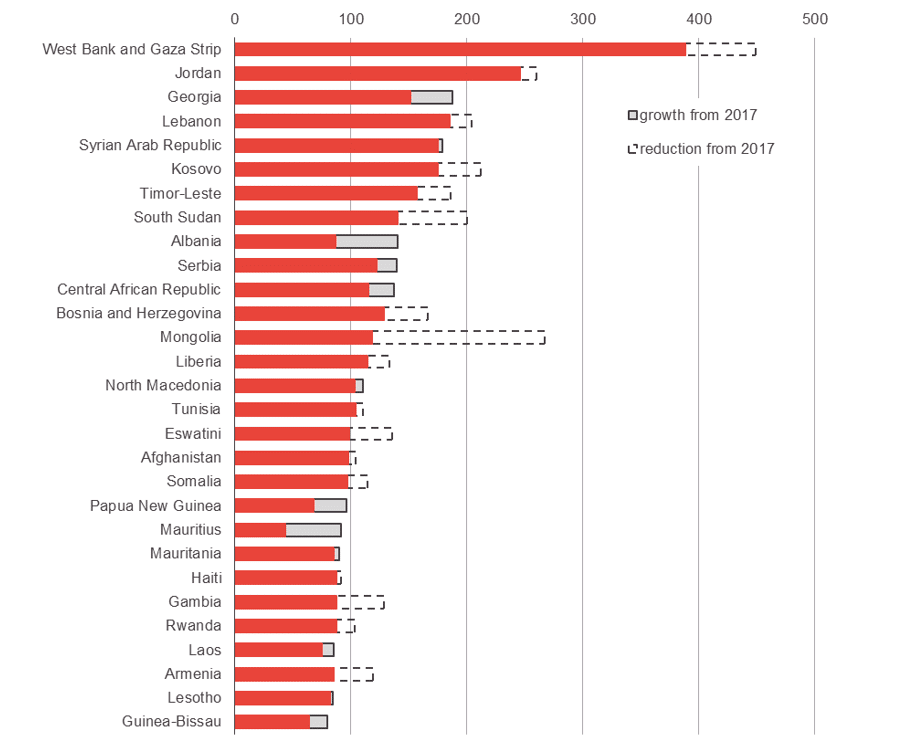
The Palestinian Territories remained the largest per capita recipient of DAC ODA among countries and territories with a population of 1 million or more, followed by Jordan, Georgia and Lebanon. Other high per capita recipient countries which saw substantial increases in ODA between 2017 and 2018 included Albania, Central African Republic, Papua New Guinea and Mauritius.
ODA to LDCs by type (2010-2018)
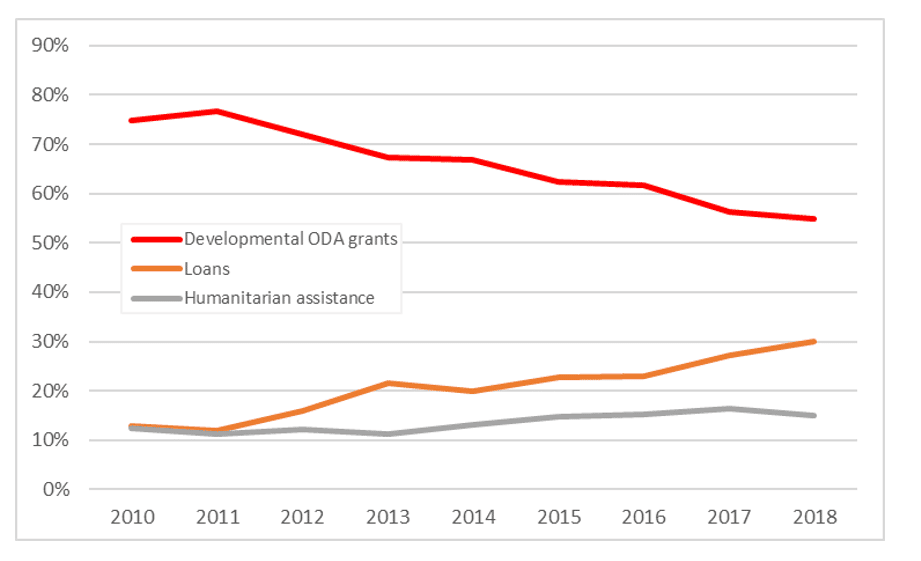
The proportion of ODA to LDCs in the form of loans more than doubled between 2010 and 2018, and now accounts for over 30% of ODA to LDCs (compared to 13% in 2010). Humanitarian assistance to LDCs has also been rising as a share of total LDC ODA, although at a slower rate (it rose from 12% in 2010 to 16% in 2017 before dropping back to 15% in 2018). Conversely, the share of ODA reaching LDCs in the form of long-term developmental grants has been decreasing, from 75% of total LDC ODA in 2010 to 55% in 2018.
The OECD DAC’s most recent ODA data release is available here, and the full dataset can be accessed via OECD Stat.
For more detailed analysis of the OECD DAC’s latest ODA data release, please see Development Initiatives Final ODI data for 2018 factsheet
* Under these rules, only a percentage of each ODA loan is counted as ODA, with the percentage dependent on how “concessional” – provided on terms that are substantially better than the market rate – the loan is. This is offset by the fact that loan repayments are no longer deducted from the final ODA figure for each donor. Donors are also now able to report some additional investments in the private sector of developing nations – known as Private Sector Instruments (PSIs) – as ODA. In order to compare data against previous years, the OECD has published ODA figures for 2018 calculated according to the previous “net ODA” (or cashflow-based) measure as well as the new “grant equivalent” measure of ODA. For more information on the changes to ODA rules see the technical note from the UK’s Department for International Development (available here) and Development Initiatives’ ODA modernisation background paper (available here).
^ Gross disbursements by DAC donors and multilaterals at constant 2017 prices.
Category
News & viewsThemes
Funding