4 trends in global humanitarian aid
The need to reform and re-shape financing in crisis contexts is well-known.
More money, from a wider range of sources, is needed to fill the gap between what is required to meet the needs of those in crisis and what is available. This assistance also needs to be delivered more efficiently and effectively.
Every year, Development Initiatives publishes the Global Humanitarian Assistance report – an independent, accessible digest of the latest state of humanitarian and crisis-related financing. Our research for this year’s report, which will be published in September, highlights the extent to which the humanitarian financing landscape is (and is not) changing.
Here are some key trends from our new briefing Key trends in global humanitarian assistance 2019.
1. Humanitarian aid is growing – slowly
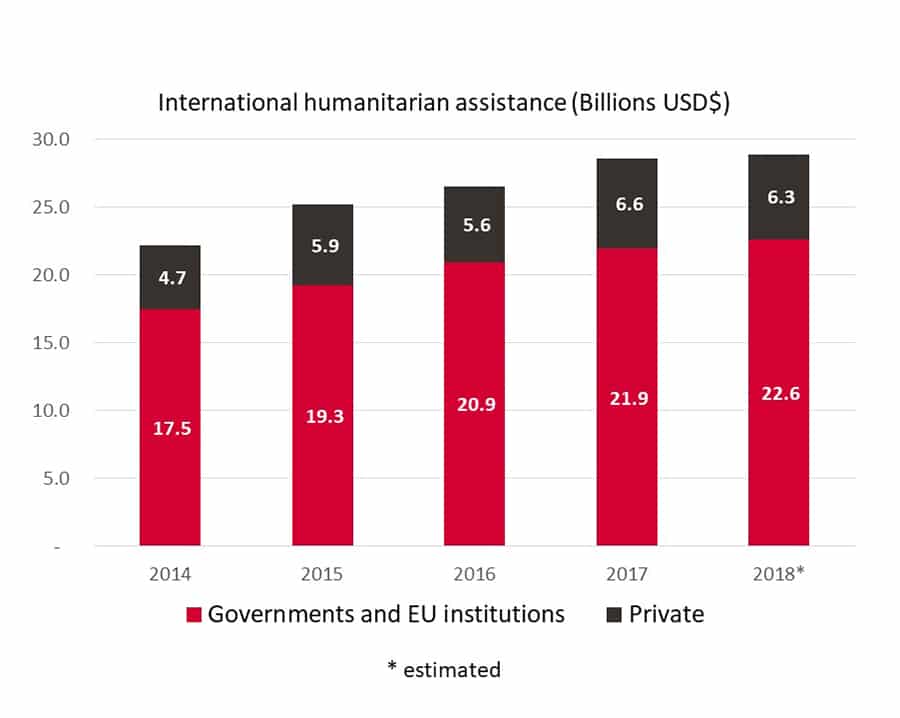
We have witnessed significant growth in the volumes of international humanitarian assistance provided by governments, EU institutions and private donors in recent years. The available data shows that this reached $28.9 billion in 2018 – growth of 30% between 2014 and 2018.
Yet the pace of growth has slowed. Total international humanitarian assistance grew by just 1% in 2018.
2. The biggest donors are giving more of the total
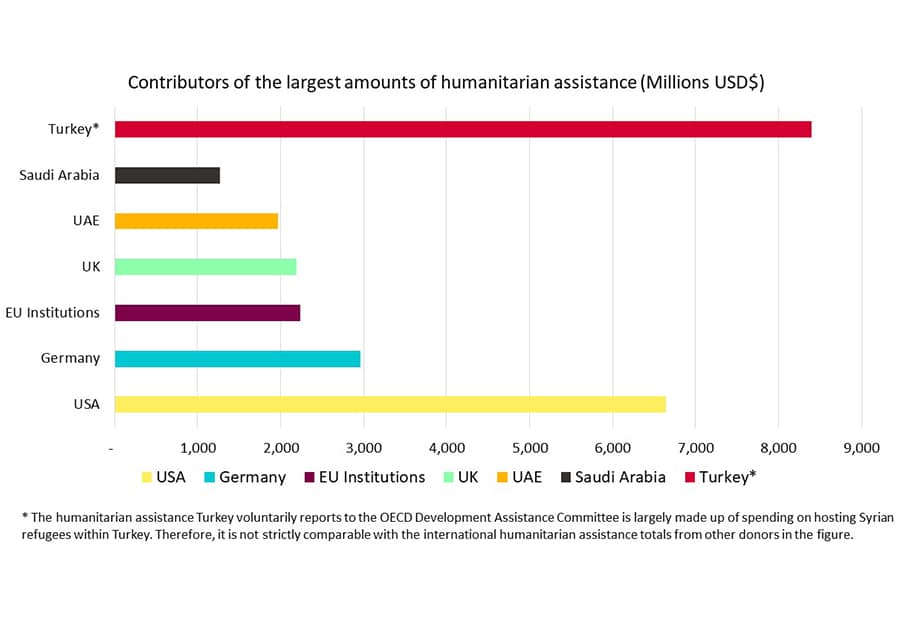
In 2018, the 20 largest donors accounted for an even greater share of all assistance from governments and EU institutions than in 2017, rising from 95% to 98%.
The share of all assistance from public donors from the three largest contributors – the US, Germany and the UK – did reduce by 7% in 2018, but their assistance still accounted for more than half (52%) of the total.
There was also a sharp rise in the volume of funding given by governments in the Middle East and North of Sahara region, following two consecutive years of falling levels of assistance.
Subscribe to our newsletter
Our weekly email newsletter, Network News, is an indispensable weekly digest of the latest updates on funding, jobs, resources, news and learning opportunities in the international development sector.
Get Network NewsThis rise was primarily driven by a combined increase in contributions from 2017 of US$2.5 billion from the United Arab Emirates and Saudi Arabia.
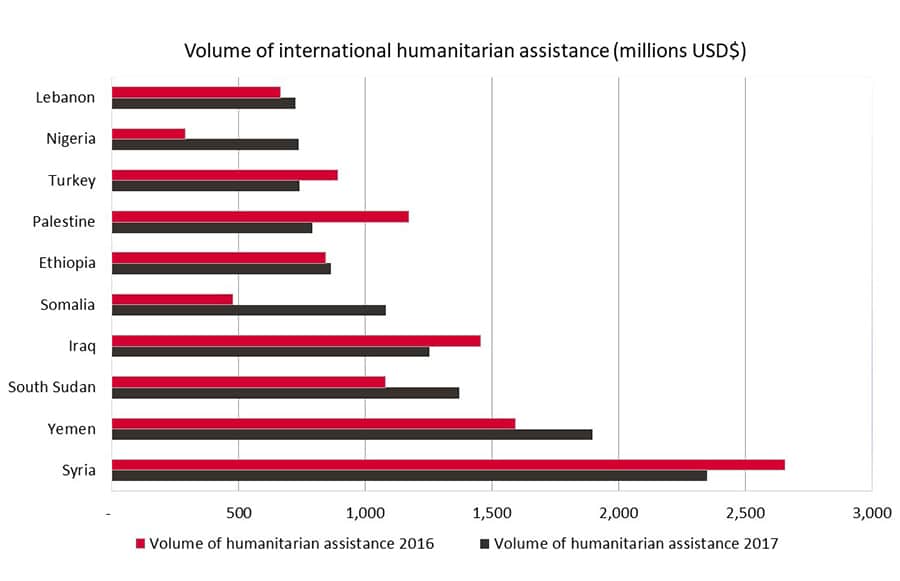
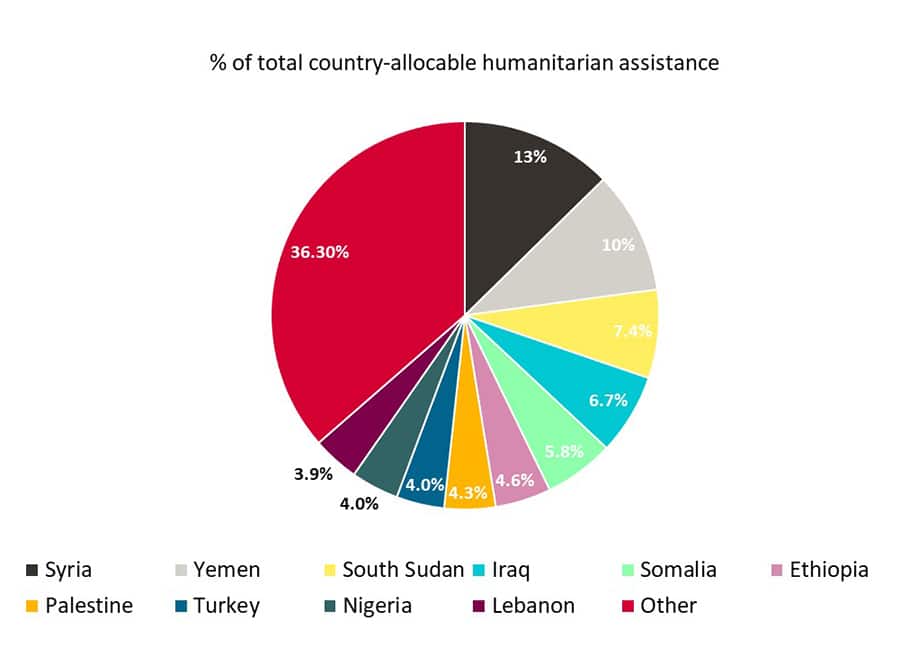
3. Assistance continues to be concentrated among a small number of crises
We also see no shift in the historic pattern of assistance being concentrated on a small number of crises. In 2017, Syria, Yemen and South Sudan alone accounted for 30% of total country-allocable assistance.
Of the assistance directed to the 10 largest recipients, 59% went to countries in the Middle East and North of Sahara region, with 34% flowing to countries in sub-Saharan Africa.
4. Wider aid flows to crisis countries are changing
Humanitarian crises are lasting longer and demanding ever more resources. They are also disproportionately affecting the poorest and most vulnerable. It is important that we understand the wider resources flows to crisis countries and how these could help to alleviate crisis. We also need to understand how these flows could address the underlying developmental factors that can drive crisis and worsen its impact.
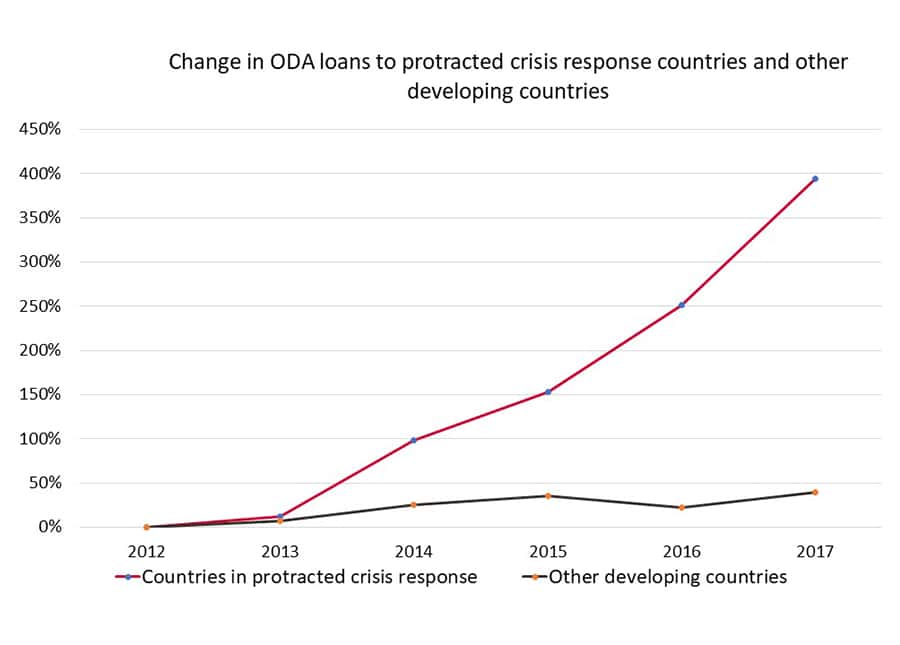
We’ve identified a shift in how aid is delivered to countries in crisis. There has been notable growth (+40%) in the volume of official development assistance (ODA) delivered as loans to developing countries that are not the subject of a protracted crisis response – but for countries with a protracted crisis response, the volume of ODA delivered as loans has grown by 394% over the same period.
To understand the impact of this trend, we need to better appreciate who is providing these loans and how they are targeted – issues that we will begin to unpack further in September’s GHA report.
These trends and the increased concentration of crises among the world’s poorest are evidence that poverty and crisis must be addressed hand in hand. This means tackling crisis in the poorest countries as well as poverty in crisis contexts.
Be in the discussion about the future of humanitarian aid. Join our humanitarian group and join the conversation.
Sources for data:
Fig 1 (International humanitarian assistance)
Source: Development Initiatives’ Factsheet: Key trends in global humanitarian assistance 2019 based on OECD Development Assistance Committee (DAC), UN Office for the Coordination of Humanitarian Affairs (OCHA) Financial Tracking Service (FTS) and UN Central Emergency Response Fund (CERF) data and Development Initiatives’ unique dataset for private contributions.
Fig 2 (Contributors of the largest amounts of humanitarian assistance)
Source: Development Initiatives’ Briefing: Key trends in global humanitarian assistance 2019 based on OECD Development Assistance Committee (DAC), UN OCHA Financial Tracking Service (FTS) and UN Central Emergency Response Fund data (CERF).
Fig 3 (Volume of international humanitarian assistance)
Source: Development Initiatives’ Factsheet: Key trends in global humanitarian assistance 2019 based on OECD DAC, UN OCHA’s FTS and UN CERF data.
Fig 4 (Change in ODA loans to protracted crisis response countries and other developing countries)
Source: Development Initiatives’ Factsheet: Key trends in global humanitarian assistance 2019 based on OECD DAC and UN OCHA’s FTS.
Category
News & views