
OECD releases final overseas aid figures for 2017
At the end of last year the Organisation for Economic Co-operation and Development’s (OECD) Development Co-operation Directorate released the final figures for total Official Development Assistance (ODA) by Development Assistance Committee (DAC) members.
These figures, which update the provisional ODA figures released in April 2017, show that total net ODA in real terms fell by US$213 million, from US$144.9bn to US$144.7bn (the first real terms reduction since 2012), and ODA as a percentage of donors’ Gross National Income (GNI) also fell marginally from 0.32% in 2016 to 0.31%.
DAC members’ net ODA and ODA as a % of GNI (1960-2017)
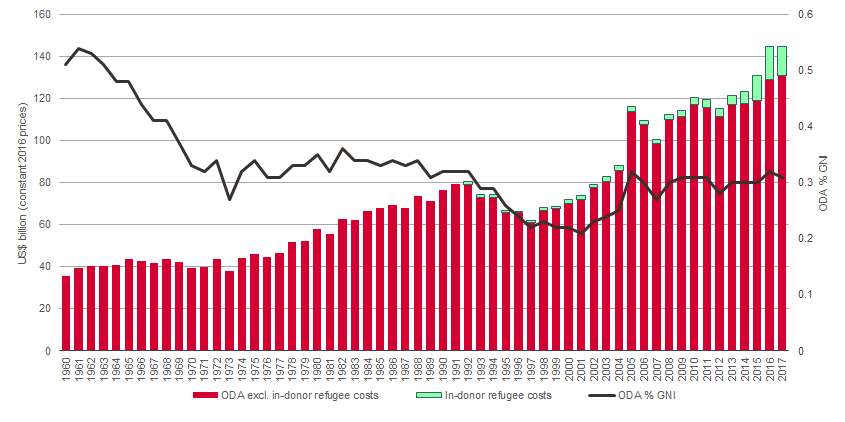
Source: Development Initiatives’ Final ODA data for 2017 factsheet, based on OECD DAC. Click here to download full data in xls format.
Top ten ODA donors in 2017
| Donor | 2016 | 2017 constant 2016 prices | $ change constant 2016 prices |
% change | 2017 current prices |
| United States | 34,421 | 34,118 | -303 | -0.9% | 34,732 |
| Germany | 24,736 | 24,157 | -579 | -2.3% | 25,005 |
| United Kingdom | 18,053 | 18,592 | +539 | +3% | 18,103 |
| Japan | 10,417 | 11,851 | +1434 | +13.8% | 11,463 |
| France | 9,622 | 11,025 | +1404 | +14.6% | 11,331 |
| Italy | 5,087 | 5,726 | +639 | +12.6% | 5,858 |
| Sweden | 4,894 | 5,430 | +537 | +11% | 5,563 |
| Netherlands | 4,966 | 4,826 | -141 | -2.8% | 4,958 |
| Canada | 3,930 | 4,116 | +186 | +4.7% | 4,305 |
| Norway | 4,380 | 3,944 | -436 | -9.9% | 4,125 |
All figures USD$m.
Source: Development Initiatives’ Final ODA data for 2017 factsheet, based on OECD DAC. Click here to download full data in xls format.
Subscribe to our newsletter
Our weekly email newsletter, Network News, is an indispensable weekly digest of the latest updates on funding, jobs, resources, news and learning opportunities in the international development sector.
Get Network NewsIn absolute terms, the United States continued to be the single largest provider of ODA (US$34.7bn at current prices and exchange rates, representing 0.18% of GNI), followed by Germany (US$25bn: 0.67%), the United Kingdom (US$18.1bn: 0.7%), Japan (US$11.5bn: 0.23%) and France (US$11.3bn: 0.43%).
DAC members’ ODA as a percentage of GNI in 2017
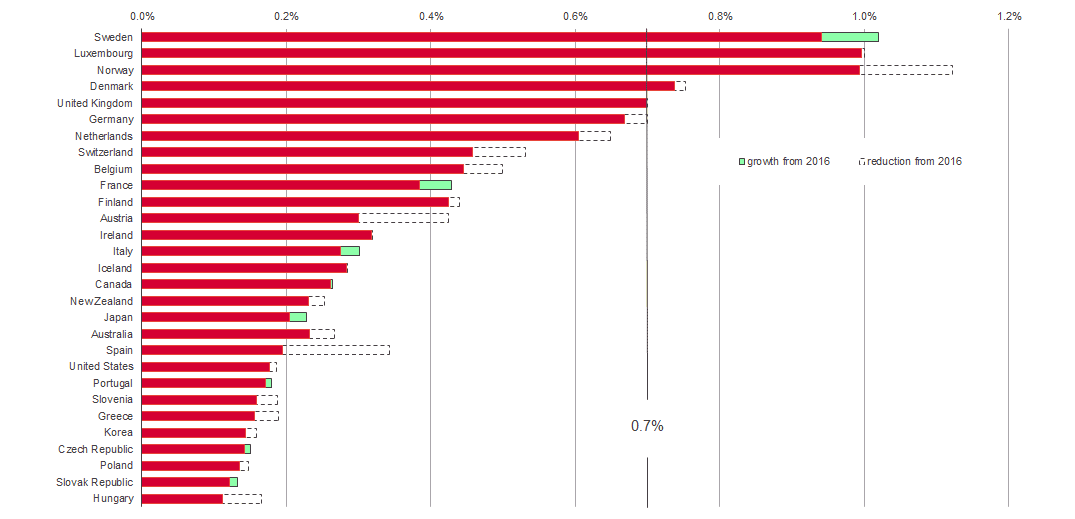
Source: Development Initiatives’ Final ODA data for 2017 factsheet, based on OECD DAC. Click here to download full data in xls format.
Relative to GNI, Sweden (1.02%), Luxembourg (1%) and Norway (0.99%) remain the most generous donors, followed by Denmark (0.74%) and the United Kingdom (0.7%). Only five donors (including the United Kingdom) achieved the 0.7% of GNI ODA target in 2017, down from six in 2016, with ODA as a percentage of GNI falling in 21 of 29 DAC members in 2017.
Top recipients of total DAC ODA in 2017
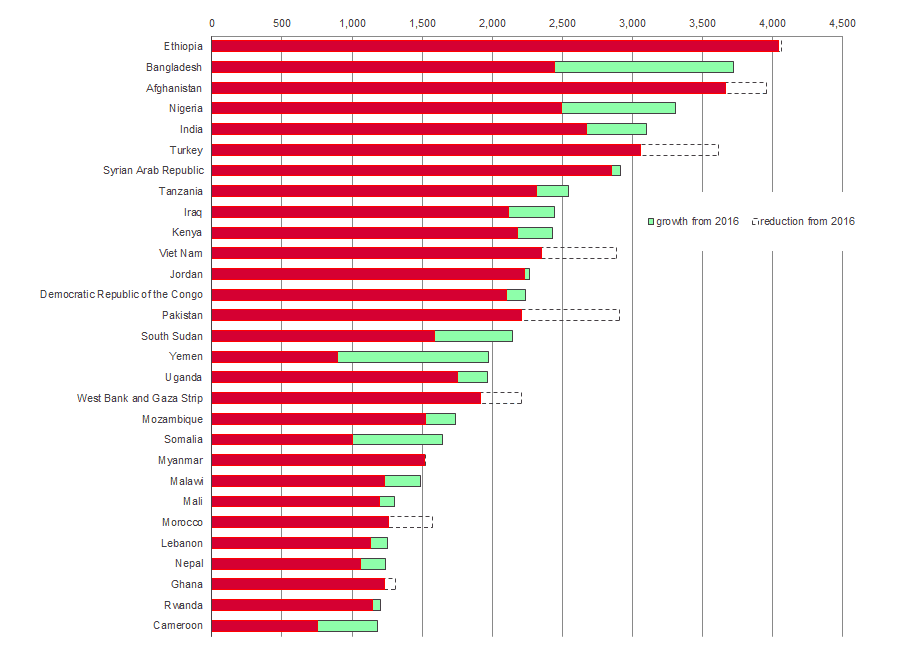
Figures are USD$ millions, constant with 2016 prices.
Source: Development Initiatives’ Final ODA data for 2017 factsheet, based on OECD DAC. Click here to download full data in xls format.
From 2016 to 2017, Ethiopia remained the largest recipient of DAC ODA in absolute terms. Several countries saw significant increases in DAC ODA receipts in 2017 including Bangladesh, Nigeria, Yemen and Somalia, all driven (at least partly) by increases in humanitarian assistance. Bangladesh joined the top 5 recipients, moving up 7 places from 2016 to 2017 and displacing Afghanistan as the 2nd largest recipient (with the latter ranked the 3rd largest in 2017). Countries with large decreases included India (which remains the 5th largest recipient), Pakistan, Kenya and Vietnam.
Top per capita recipients of DAC ODA in 2017
The Palestinian Territories remained the largest per capita recipient of DAC ODA among countries and territories with a population of 1 million or more, followed by Mongolia, Jordan and Lebanon. Other high per capita recipient countries which saw substantial increases in ODA between 2016 and 2017 included Gambia, Somalia and Yemen.
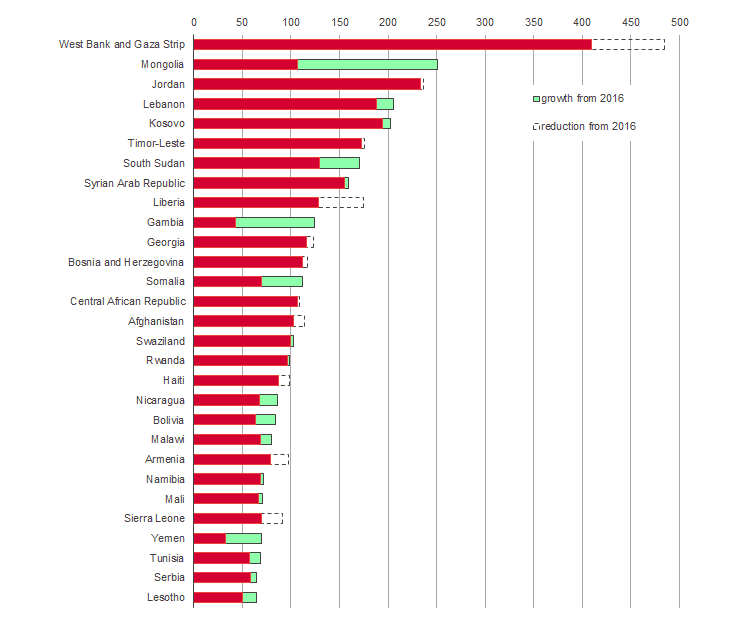
Figures are USD$ per capita, constant with 2016 prices.
Source: Development Initiatives’ Final ODA data for 2017 factsheet, based on OECD DAC. Click here to download full data in xls format.
The OECD DAC’s most recent ODA data release is available here, and the full dataset can be accessed via OECD Stat.
For more detailed analysis of the OECD DAC’s latest ODA data release, please see Development Initiatives’ 2017 ODA factsheet.
Category
News & views