Stats on international development: how did the UK spend aid in 2019?
The Department for International Development (DFID) has released the annual Statistics on International Development report, which provides final statistics on how much Official Development Assistance (ODA) the UK provided in 2019.
Highlights
The report includes UK ODA as a proportion of Gross National Income (GNI) which has again met the 0.7% spending target.
In 2019, total UK ODA rose from £14,552m in 2018 to £15,197m, an increase of £645m (4.4%), and DFID’s percentage share of total UK ODA fell slightly from 74.9% (£10,897m) to 73.1% (£11,107m). Correspondingly, the share of aid spent by other government departments and other contributors to UK ODA fell to 26.9% (£4,090m).
Bilateral and multilateral ODA
- The split between bilateral and multilateral ODA shifted by several percentage points, with bilateral ODA (including specifically-earmarked aid delivered via multilaterals) increasing to 67.5% (£10,258m), and direct multilateral ODA falling to 32.5% (£4,939m). In 2018, bilateral and core multilateral aid represented 63.5% (£9,239m) and 36.5% (£5,313m) of total ODA respectively.
- Bilateral aid increased by 11% (£1,019m) to £10,258m, while core contributions to multilaterals fell by 7% (£374m) to £4,939m.
- Total UK ODA contributions to the International Bank for Reconstruction and Development (IBRD) and International Development Association (IDA) fell from £2,354m in 2018 to £1,466m in 2019, a significant decrease of 62.3% (£888m).
- The estimated UK share of the EU developmental budget in 2019 was £983m, an increase of £32m (3.4%) from £951m in 2018. In addition, the UK contributed £850m to the European Development Fund (EDF), an increase of £412m (93.9%) relative to 2018 (£439m).
How did departments spend ODA?
DFID’s relative share of the aid budget fell to 73.1% (£11,107m) in 2019, down from 74.9% (£10,897m) in 2018. In absolute terms, this represented an increase of £211m (1.9%).
The relative share of aid that other government departments, cross-departmental funds and other aid contributors manage rose to 26.9% (£4,090m), up from 25.1% (£3,655m) in 2018. In absolute terms, this represented an increase of £434m (11.9%).
Subscribe to our newsletter
Our weekly email newsletter, Network News, is an indispensable weekly digest of the latest updates on funding, jobs, resources, news and learning opportunities in the international development sector.
Get Network NewsSignificant non-DFID departmental allocations include:
- Business, Energy & Industrial Strategy (BEIS) – 6.3% of total ODA or £960m (5.8% or £851m in 2018), an increase of £110m (12.9%).
- Foreign & Commonwealth Office (FCO) – 4.5% of total ODA or £679m (4.4% or £633m in 2018), an increase of £46m (7.2%).
- Conflict, Stability and Security Fund (CSSF) – 4.3% of total ODA or £659m (4.2% or £605m in 2018), an increase of £54m (8.8%).
- Home Office – 3% of total ODA or £452m (2.3% or £337m in 2018), an increase of £115m (34%).
- Non-department sources (items not on any departments’ budget) included the non-DFID EU attribution (3.2%, or £481m), Gift Aid (1%, or £159m), and the World Service (0.2% or £29m).
- DFID also made a non-grant aid investment of £1,008m in CDC Group in 2019 (£742m in 2018), an increase of £266m, which is included within DFID’s total ODA expenditure.
Which countries received bilateral aid?
Of the UK’s total bilateral ODA, less than two thirds (57.6%, or £5,908bn) was allocated to specific countries and regions in 2019, down from 61.3% (£5,659m) in 2018 and 67% (£5,901m) in 2017.
The majority of country-specific ODA (£3,815m, or 76.2%) was spent by DFID, 65.1% of which was spent in Least Developed Countries (LDCs) (£2,485m), with country-specific ODA by non-DFID contributors (£1,190m) going primarily to lower and upper middle income countries (£440m to LMICs and £412m to UMICs, with LDCs receiving £339m or 28.5%).
The top five recipients of UK country-specific bilateral ODA in 2019 were Pakistan (£305m), Ethiopia (£300m), Afghanistan (£292m), Yemen (£260m) and Nigeria (£258m), together accounting for 28.3% (£1,415m) of total country-specific bilateral ODA (£5,005m).
Nigeria saw the largest reduction in bilateral ODA, with spend falling from £297m in 2018 to £258m in 2019. After Yemen (with an increase of £94m from £166m), Bangladesh and South Sudan saw the largest increase in UK ODA in 2019, with spend increasing by £66m (from £190m to £256m) and £56m (£151m to £207m) respectively.
Other allocation of UK bilateral aid
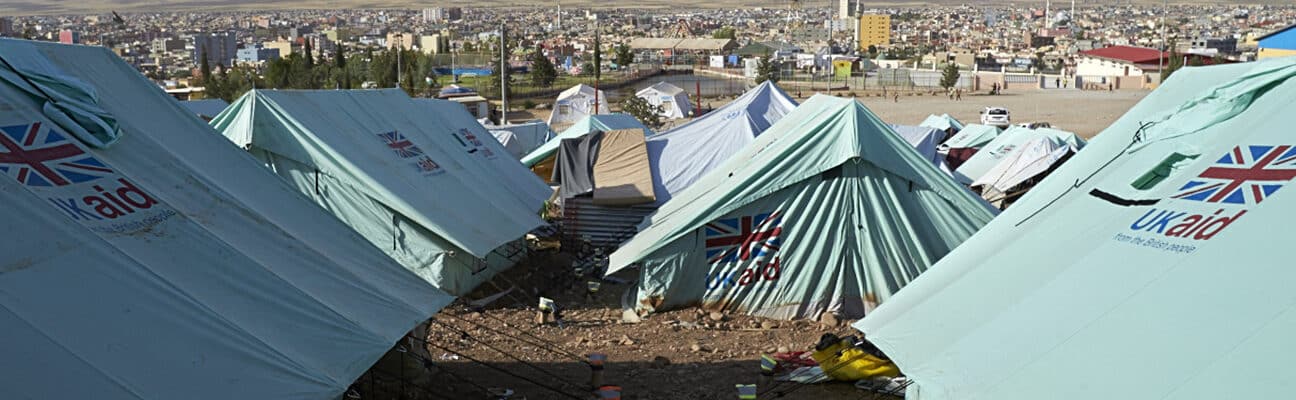
15% of total bilateral ODA (£1,536m) was spent on humanitarian assistance, an increase of 18.3% (£237m) relative to 2018 (£1,299m).
Spending in-country
Expenditure on in-donor refugee costsrose sharply in 2019 to £477m or 4.7% of bilateral ODA in 2019 (from £370m or 4% in 2018), an increase of 29.1% (£108m). Recorded ODA for in-donor refugee costs had previously increased by over 1,400% between 2012 and 2016, primarily reflecting increased counting of existing in-donor refugee costs as ODA.
Category
News & viewsThemes
UK aid