OECD releases preliminary overseas aid figures for 2019
Last week the Organisation for Economic Co-operation and Development’s (OECD) Development Co-operation Directorate released the provisional figures for total Official Development Assistance (ODA) by Development Assistance Committee (DAC) members in 2019.
The rules governing ODA have changed, and this is the second set of ODA statistics published under new rules regarding how ODA is accounted for*. Under these rules, only a percentage of each ODA loan is counted as ODA, with the percentage dependent on how “concessional” – provided on terms that are substantially better than the market rate – the loan is. This is offset by the fact that loan repayments are no longer deducted from the final ODA figure for each donor.
In order to compare data against previous years, the OECD has published ODA figures for 2018 calculated according to the previous “net ODA” (or cashflow-based) measure as well as the new “grant equivalent” measure of ODA.
Topline figures
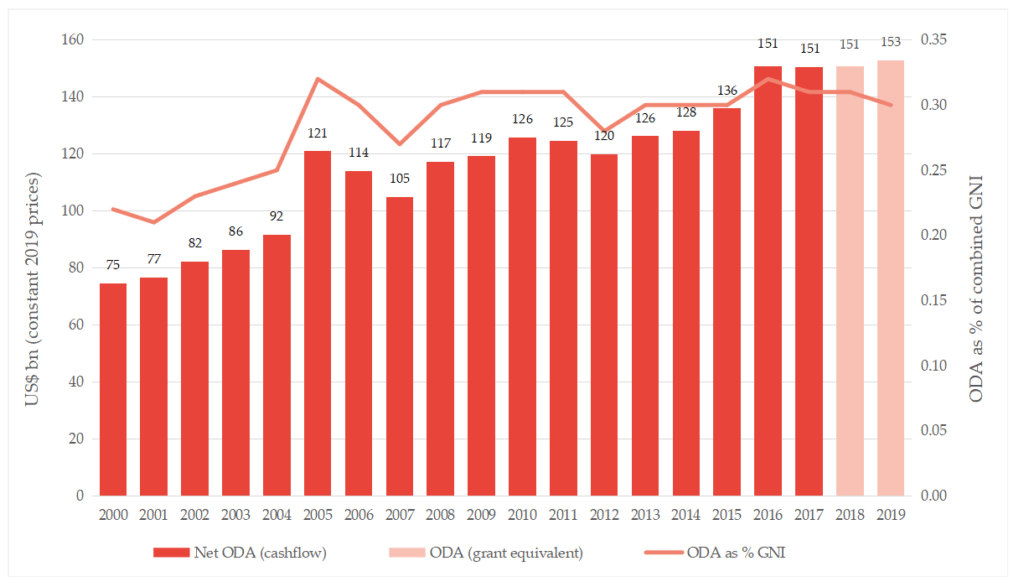
These figures show that total ODA from OECD DAC members was $152.8bn in 2019, a real terms increase of 1.4%, but that ODA as a percentage of donors’ combined Gross National Income (GNI) fell from 0.31% to 0.30% (having previously fallen from 0.32% in 2016 to 0.31% in 2017). Excluding in-donor refugee costs, which fell 2% from 2018 to $10.2bn, ODA increased by 1.7% in real terms.
Figure 1: DAC members’net ODA (2000-2017), grant equivalent ODA (2018-2019) and ODA as a % of GNI (2000-2019)
In absolute terms, the United States continued to be the single largest provider of ODA (US$34.6bn in grant equivalent ODA at current prices and exchange rates, representing 0.16% of GNI), followed by Germany (US$23.8bn: 0.60%), the United Kingdom (US$19.4bn: 0.7%), Japan (US$15.1bn: 0.29%) and France (US$12.2bn: 0.44%). DAC European Union (EU) members (including the UK) together provided over half (55%, or $84.5bn) of total OECD DAC aid, with the United States contributing 23% and Japan 10%.
Table 1: Total grant equivalent ODA by donor (2018-2019)
|
Donor |
ODA (grant equivalent) 2019 |
ODA (grant equivalent) 2018 |
US$ m difference |
% difference |
|
Australia |
2,949 |
3,025 |
-76 |
-2.5% |
|
Austria |
1,211 |
1,128 |
83 |
7.4% |
|
Belgium |
2,177 |
2,228 |
-51 |
-2.3% |
|
Canada |
4,673 |
4,648 |
24 |
0.5% |
|
Czech Republic |
306 |
298 |
8 |
2.6% |
|
Denmark |
2,546 |
2,485 |
61 |
2.5% |
|
Finland |
1,126 |
953 |
174 |
18.2% |
|
France |
12,176 |
11,681 |
496 |
4.2% |
|
Germany |
23,806 |
24,144 |
-338 |
-1.4% |
|
Greece |
308 |
278 |
30 |
11.0% |
|
Hungary |
317 |
277 |
40 |
14.5% |
|
Iceland |
67 |
69 |
-1 |
-1.6% |
|
Ireland |
935 |
895 |
40 |
4.5% |
|
Italy |
4,900 |
4,951 |
-51 |
-1.0% |
|
Japan |
15,507 |
14,426 |
1,080 |
7.5% |
|
Korea |
2,521 |
2,213 |
308 |
13.9% |
|
Luxembourg |
474 |
462 |
13 |
2.7% |
|
Netherlands |
5,292 |
5,516 |
-224 |
-4.1% |
|
New Zealand |
559 |
541 |
18 |
3.4% |
|
Norway |
4,292 |
3,912 |
380 |
9.7% |
|
Poland |
684 |
742 |
-57 |
-7.7% |
|
Portugal |
373 |
394 |
-21 |
-5.4% |
|
Slovak Republic |
129 |
134 |
-5 |
-4.0% |
|
Slovenia |
86 |
81 |
5 |
5.8% |
|
Spain |
2,896 |
2,784 |
111 |
4.0% |
|
Sweden |
5,397 |
5,670 |
-274 |
-4.8% |
|
Switzerland |
3,093 |
3,073 |
20 |
0.6% |
|
United Kingdom |
19,369 |
18,956 |
413 |
2.2% |
|
United States |
34,615 |
34,761 |
-146 |
-0.4% |
|
Total DAC |
152,785 |
150,725 |
2,060 |
1.4% |
|
EU Institutions |
14,827 |
15,787 |
-959 |
-6.1% |
Under the new grant equivalent methodology, ODA in 2019 is US$5.4bn higher compared to under the previous net cashflow approach (US$147.4bn). In particular, Japan’s ODA appears much higher under the new methodology due to its large and highly concessional loan portfolio (under the net cashflow approach Japan’s total 2019 ODA would be 25% smaller at US$ 11.6bn”). ODA from the United States is also higher under the new measure than it would otherwise be because, although the United States does not currently provide ODA loans, it has a large stock of old loans on which it is receiving repayments (under the new rules these repayments are no longer deducted from headline ODA).
Table 2: Total grant equivalent and net ODA by donor (2019)
|
Donor |
ODA (grant equivalent) |
Net ODA (cashflow basis) |
US$m difference |
% difference |
|
Australia |
2,949 |
2,949 |
0 |
0% |
|
Austria |
1,211 |
1,208 |
3 |
0% |
|
Belgium |
2,177 |
2,211 |
-34 |
-2% |
|
Canada |
4,673 |
4,514 |
159 |
4% |
|
Czech Republic |
306 |
306 |
0 |
0% |
|
Denmark |
2,546 |
2,534 |
12 |
0% |
|
Finland |
1,126 |
1,144 |
-18 |
-2% |
|
France |
12,176 |
11,980 |
197 |
2% |
|
Germany |
23,806 |
23,729 |
77 |
0% |
|
Greece |
308 |
308 |
0 |
0% |
|
Hungary |
317 |
317 |
0 |
0% |
|
Iceland |
67 |
67 |
0 |
0% |
|
Ireland |
935 |
935 |
0 |
0% |
|
Italy |
4,900 |
4,733 |
167 |
4% |
|
Japan |
15,507 |
11,639 |
3,867 |
33% |
|
Korea |
2,521 |
2,575 |
-54 |
-2% |
|
Luxembourg |
474 |
474 |
0 |
0% |
|
Netherlands |
5,292 |
5,292 |
0 |
0% |
|
New Zealand |
559 |
559 |
0 |
0% |
|
Norway |
4,292 |
4,292 |
0 |
0% |
|
Poland |
684 |
669 |
16 |
2% |
|
Portugal |
373 |
344 |
29 |
8% |
|
Slovak Republic |
129 |
129 |
0 |
0% |
|
Slovenia |
86 |
86 |
0 |
0% |
|
Spain |
2,896 |
2,662 |
234 |
9% |
|
Sweden |
5,397 |
5,396 |
1 |
0% |
|
Switzerland |
3,093 |
3,089 |
4 |
0% |
|
United Kingdom |
19,369 |
19,343 |
27 |
0% |
|
United States |
34,615 |
33,889 |
726 |
2% |
|
Total DAC |
152,785 |
147,373 |
5,411 |
4% |
|
EU Institutions |
14,827 |
15,154 |
-326 |
-2% |
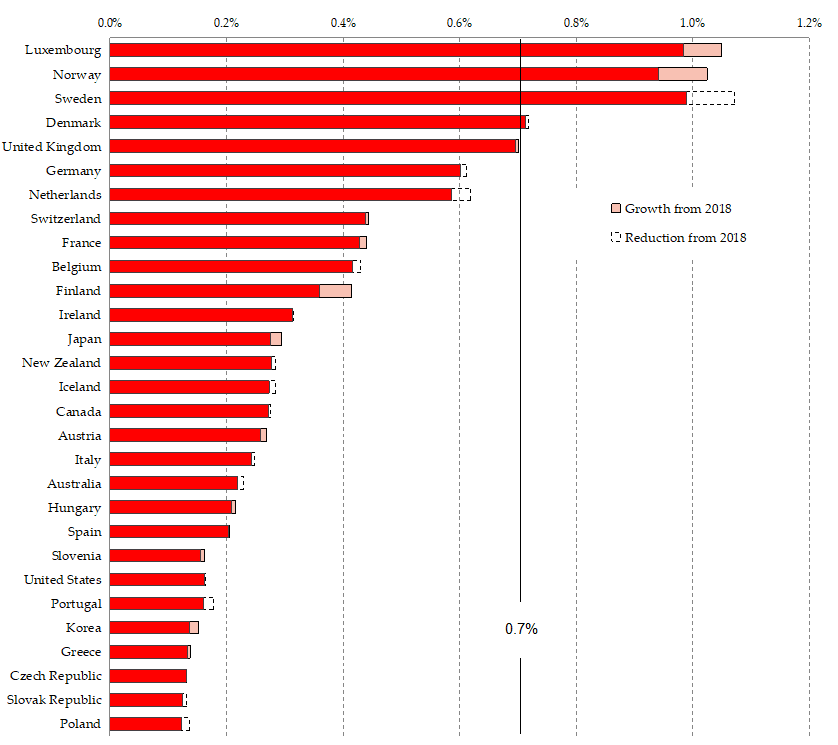
As in 2017 and 2018, only five donors (including the United Kingdom) achieved the 0.7% of GNI ODA target in 2019, with ODA as a percentage of GNI falling in 16 of 29 DAC members in 2019.
Relative to gross national income (GNI), Luxembourg (1.05%), Norway (1.02%) and Sweden (0.99%) remain the most generous donors, followed by Denmark (0.71%) and the United Kingdom (0.70%). The change in measurement of ODA has made no difference to the number of donors achieving 0.7%.
Figure 2: Total ODA by donor as a % of GNI (2018-2019)
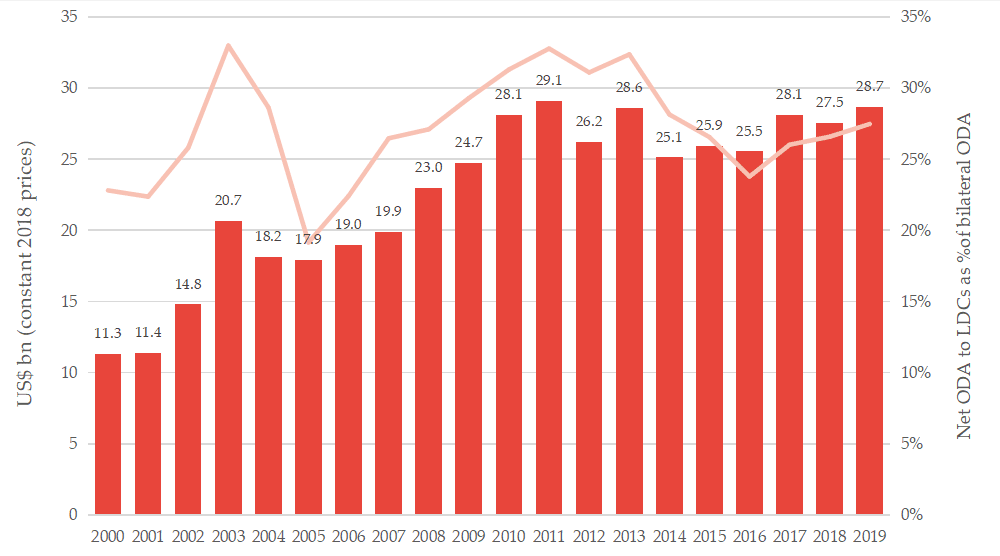
ODA to LDCs is estimated to have increased by 4.2% (or US$1.2bn) between 2018 and 2019 to US$28.7bn (still slightly below its 2011 peak). At a donor level, notable increases in ODA to LDCs included the United States (an increase of US$821m) and the UK (an increase of US$359m). In 2019 a total of eight donors (Belgium, Iceland, Ireland, Korea, Luxembourg, Portugal, Sweden and the US) were estimated to have given over 30% of their bilateral ODA to LDCs.
Figure 3: Total net bilateral ODA to Least Developed Countries (LDCs) (2000-2019)~
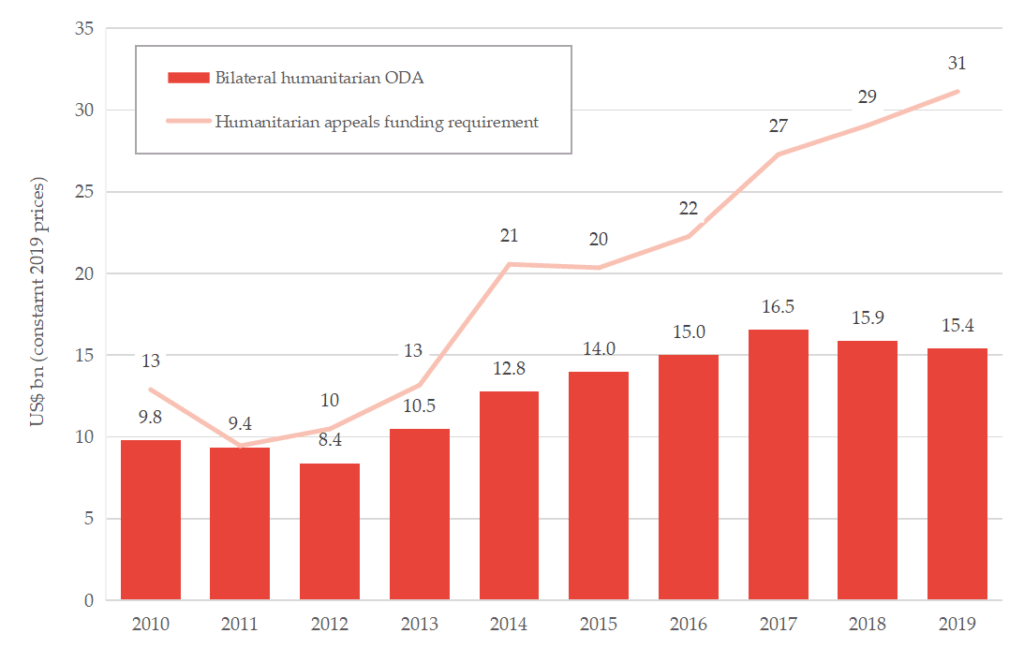
Humanitarian aid almost doubled between 2012 and 2017, growing significantly faster than development aid over the period, however humanitarian aid from DAC members has reduced year on year since 2017, falling to US$15.4bn in 2019. Conversely, funding requirements to respond to crises has continued to rise, resulting in a funding gap that has expanded over the last decade.
Figure 4: Bilateral humanitarian ODA from DAC donors and humanitarian appeals funding requirement (2010-2019)¬
The OECD DAC’s most recent ODA data release is available here, and the full dataset can be accessed via OECD Stat.
You can find more information, and access the full datasets, in Development Initiatives’ briefing Coronavirus and aid data: What the latest DAC data tells us.
You can also see our analysis of the final 2018 figures on ODA spend.
* For more information on the changes to ODA rules see the technical note from the UK’s Department for International Development (available here [PDF]) and Development Initiatives’ ODA modernisation background paper (available here [PDF]).
~ ODA to LDCs is only available on a net ODA basis. Germany and Luxembourg failed to report how much of their ODA went to LDCs in 2019 so, in the absence of complete data, this chart assumes that Germany and Luxembourg gave the same proportion of support to LDCs in 2019 as they did in 2018 and applies this proportion to their 2019 net ODA levels.
¬ It is not visible from DAC data what portion of official humanitarian assistance goes to UN appeals, which serve as a proxy for global humanitarian response funding needs.
Category
News & views